import streamlit as st
import pandas as pd
import numpy as np
import matplotlib.pyplot as plt
import seaborn as sns
from tensorflow.keras.layers import InputLayer, Dense
from tensorflow.keras.models import Sequential
from tensorflow.keras.optimizers import SGD
from tensorflow.keras.regularizers import l1, l2
from mlxtend.plotting import plot_decision_regions
from sklearn.model_selection import train_test_split
from sklearn.preprocessing import StandardScaler
from sklearn.datasets import make_moons, make_blobs, make_circles
st.set_page_config(layout="wide")
st.markdown(
"""
""",
unsafe_allow_html=True
)
st.title("Neural Network Playground")
st.sidebar.markdown("Data
", unsafe_allow_html=True)
dataset = st.sidebar.selectbox("Choose a dataset", ["None", "Moons", "Blobs", "Circle"])
train_test = st.sidebar.slider("train/test %", 10, 100, 80, 10)
noise_ = st.sidebar.slider("Noise", 0.0, 1.0, 0.1)
x, y = None, None
if dataset == "Moons":
x, y = make_moons(n_samples=2000, noise=noise_, random_state=42)
st.sidebar.markdown("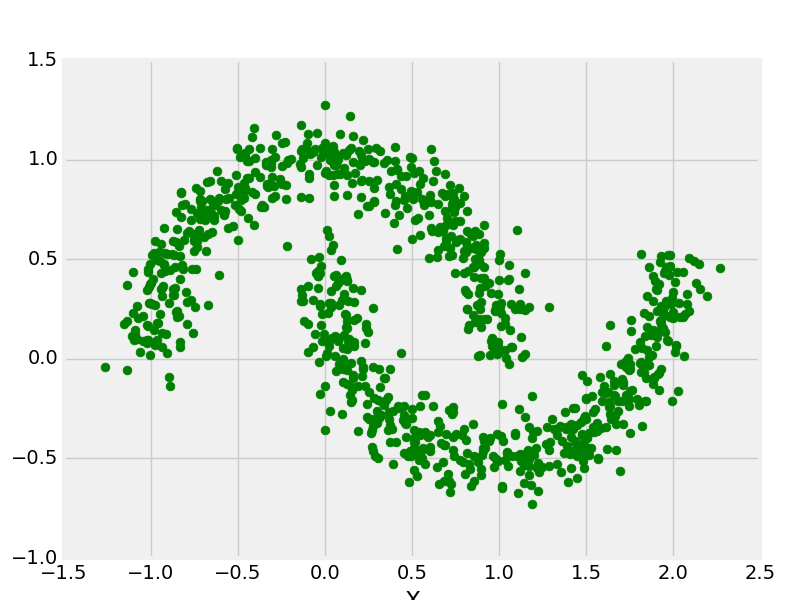 ", unsafe_allow_html=True)
elif dataset == "Blobs":
x, y = make_blobs(n_samples=2000, centers=2, cluster_std=1.0, random_state=42)
st.sidebar.markdown("
", unsafe_allow_html=True)
elif dataset == "Blobs":
x, y = make_blobs(n_samples=2000, centers=2, cluster_std=1.0, random_state=42)
st.sidebar.markdown("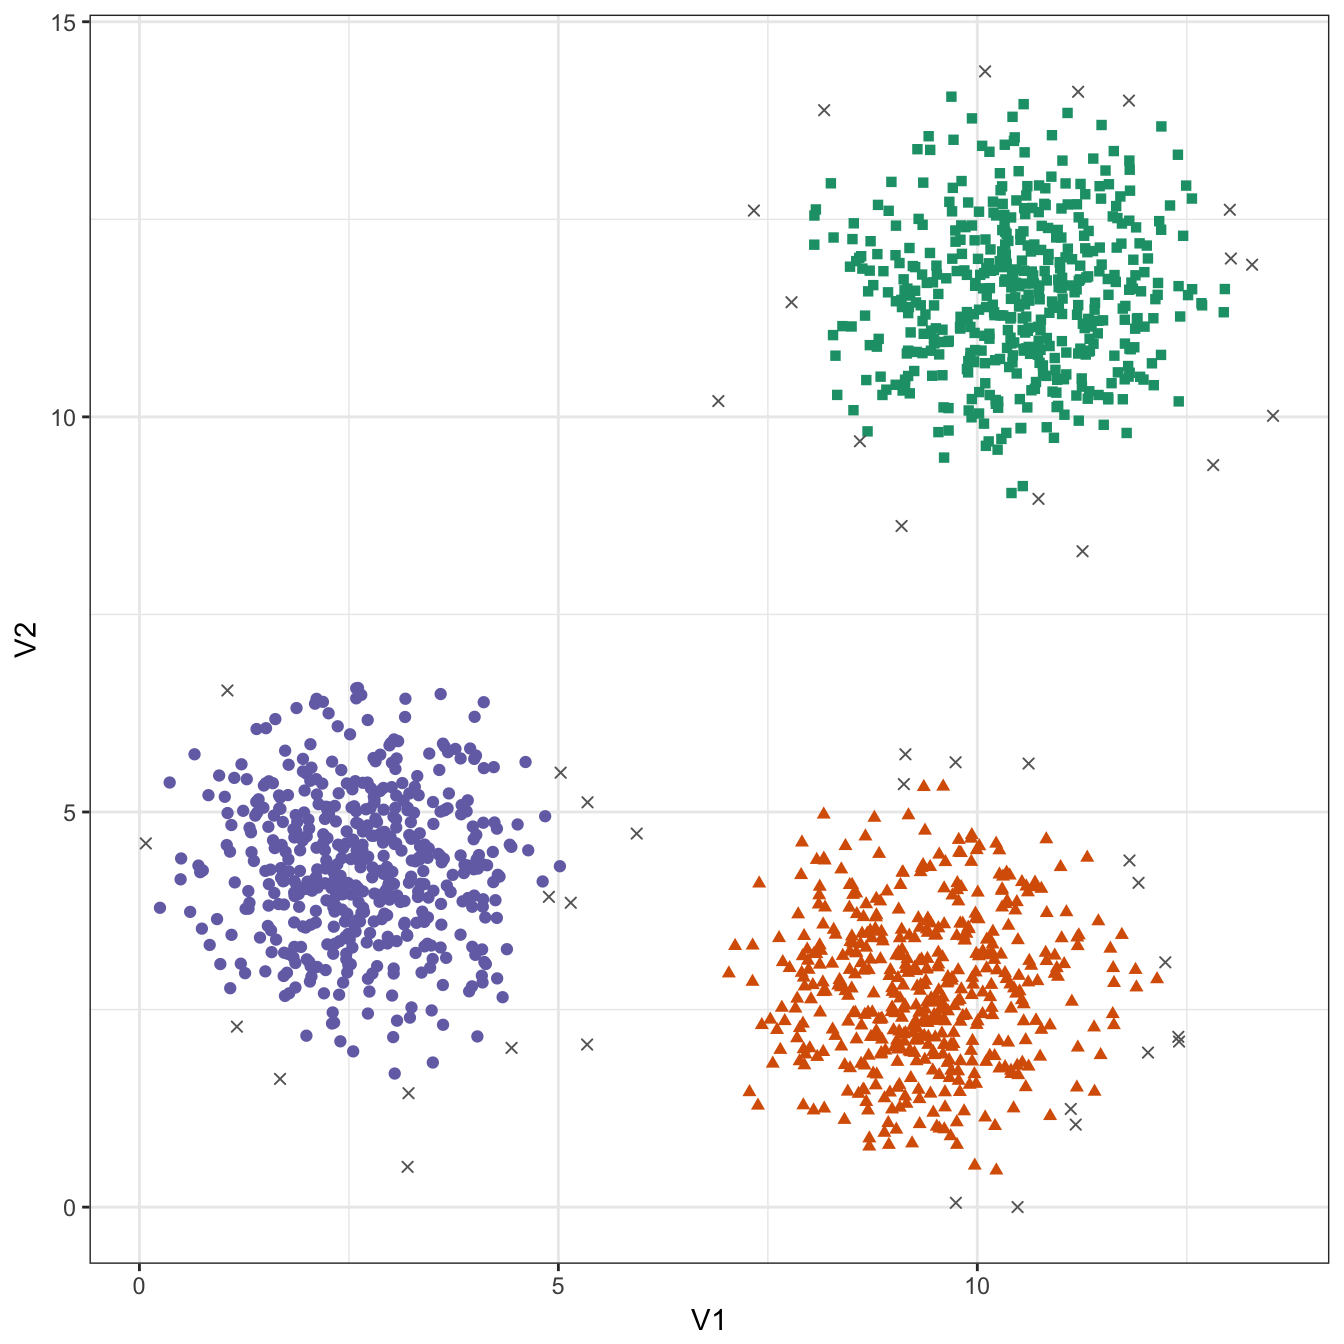 ", unsafe_allow_html=True)
elif dataset == "Circle":
x, y = make_circles(n_samples=2000, noise=noise_, factor=0.2)
st.sidebar.markdown("
", unsafe_allow_html=True)
elif dataset == "Circle":
x, y = make_circles(n_samples=2000, noise=noise_, factor=0.2)
st.sidebar.markdown(" ", unsafe_allow_html=True)
col1, col2, col3, col4, col5, col6 = st.columns(6)
with col1:
Epochs = st.number_input("Epochs", min_value=100, max_value=10000, step=100, value=200)
with col2:
Learning_rate = st.selectbox("Learning Rate",[0.1,0.01,0.001,0.0001,1])
with col3:
Activation = st.selectbox("Activation", ["tanh", "sigmoid", "relu"])
with col4:
Regularization = st.selectbox("Regularization", ["None", "L1", "L2"])
with col5:
Regularization_rate = st.selectbox("Reg. Rate",[0.001,0.003,0.01,1,3,10,0.03])
with col6:
Problem_type = st.selectbox("Problem Type", ["Classification", "Regression"])
if x is not None:
x_train, x_test, y_train, y_test = train_test_split(
x, y, test_size=(100-train_test)/100, random_state=42, stratify=y
)
std = StandardScaler()
x_train = std.fit_transform(x_train)
x_test = std.transform(x_test)
col3,col4 = st.columns(2)
with col3:
hiddenLayer = st.number_input("No of Hidden Layers", min_value=2, max_value=10, step=1, value=2)
with col4:
neurons = st.text_input("Neurons per Layer (comma-separated)", "4,2")
if neurons:
nums = list(map(int, neurons.split(",")))
else:
nums = [4, 2]
R = None
if Regularization == 'L1':
R = l1(Regularization_rate)
elif Regularization == "L2":
R = l2(Regularization_rate)
if st.button("Start Learning"):
model = Sequential()
model.add(InputLayer(input_shape=(2,)))
for i in nums:
model.add(Dense(i, activation=Activation, kernel_regularizer=R))
model.add(Dense(1, activation='sigmoid', kernel_regularizer=R))
sgd = SGD(learning_rate=Learning_rate)
model.compile(optimizer=sgd, loss='binary_crossentropy', metrics=['accuracy'])
bs = int(x_train.shape[0] - x_train.shape[0] * 0.2)
hist = model.fit(x_train, y_train, epochs=Epochs, batch_size=bs,
validation_split=0.2, verbose=False)
col1, col2 = st.columns(2)
with col1:
fig, ax = plt.subplots(figsize=(3, 2))
sns.scatterplot(
x=x_train[:, 0], y=x_train[:, 1],
hue=y_train, palette="Set2", s=15, ax=ax
)
ax.tick_params(axis='both', which='major', labelsize=5)
ax.set_title("Before Training", fontsize=6)
ax.legend(loc="upper right", fontsize=4, markerscale=0.5)
st.pyplot(fig, use_container_width=False)
with col2:
fig, ax = plt.subplots(figsize=(3, 2))
plot_decision_regions(X=x_train, y=y_train, clf=model, ax=ax, legend=2)
ax.set_title("Decision Region", fontsize=6)
ax.tick_params(axis='both', which='major', labelsize=5)
ax.legend(loc="upper right", fontsize=4, markerscale=0.5)
st.pyplot(fig, use_container_width=False)
col5, col6 = st.columns(2)
with col5:
fig, ax = plt.subplots(figsize=(3, 2))
ax.plot(range(1, Epochs+1), hist.history['loss'], label='Training Loss')
ax.plot(range(1, Epochs+1), hist.history['val_loss'], label='Validation Loss')
ax.set_title('Model Loss', fontsize=6)
ax.set_xlabel('Epoch', fontsize=6)
ax.set_ylabel('Loss', fontsize=6)
ax.legend(loc="upper right", fontsize=4, markerscale=0.5)
st.pyplot(fig, use_container_width=False)
with col6:
fig, ax = plt.subplots(figsize=(3, 2))
ax.plot(range(1, Epochs+1), hist.history['accuracy'], label='Training Accuracy')
ax.plot(range(1, Epochs+1), hist.history['val_accuracy'], label='Validation Accuracy')
ax.set_title('Model Accuracy', fontsize=6)
ax.set_xlabel('Epoch', fontsize=6)
ax.legend(loc="upper right", fontsize=4, markerscale=0.5)
ax.set_ylabel('Accuracy', fontsize=6)
st.pyplot(fig, use_container_width=False)
", unsafe_allow_html=True)
col1, col2, col3, col4, col5, col6 = st.columns(6)
with col1:
Epochs = st.number_input("Epochs", min_value=100, max_value=10000, step=100, value=200)
with col2:
Learning_rate = st.selectbox("Learning Rate",[0.1,0.01,0.001,0.0001,1])
with col3:
Activation = st.selectbox("Activation", ["tanh", "sigmoid", "relu"])
with col4:
Regularization = st.selectbox("Regularization", ["None", "L1", "L2"])
with col5:
Regularization_rate = st.selectbox("Reg. Rate",[0.001,0.003,0.01,1,3,10,0.03])
with col6:
Problem_type = st.selectbox("Problem Type", ["Classification", "Regression"])
if x is not None:
x_train, x_test, y_train, y_test = train_test_split(
x, y, test_size=(100-train_test)/100, random_state=42, stratify=y
)
std = StandardScaler()
x_train = std.fit_transform(x_train)
x_test = std.transform(x_test)
col3,col4 = st.columns(2)
with col3:
hiddenLayer = st.number_input("No of Hidden Layers", min_value=2, max_value=10, step=1, value=2)
with col4:
neurons = st.text_input("Neurons per Layer (comma-separated)", "4,2")
if neurons:
nums = list(map(int, neurons.split(",")))
else:
nums = [4, 2]
R = None
if Regularization == 'L1':
R = l1(Regularization_rate)
elif Regularization == "L2":
R = l2(Regularization_rate)
if st.button("Start Learning"):
model = Sequential()
model.add(InputLayer(input_shape=(2,)))
for i in nums:
model.add(Dense(i, activation=Activation, kernel_regularizer=R))
model.add(Dense(1, activation='sigmoid', kernel_regularizer=R))
sgd = SGD(learning_rate=Learning_rate)
model.compile(optimizer=sgd, loss='binary_crossentropy', metrics=['accuracy'])
bs = int(x_train.shape[0] - x_train.shape[0] * 0.2)
hist = model.fit(x_train, y_train, epochs=Epochs, batch_size=bs,
validation_split=0.2, verbose=False)
col1, col2 = st.columns(2)
with col1:
fig, ax = plt.subplots(figsize=(3, 2))
sns.scatterplot(
x=x_train[:, 0], y=x_train[:, 1],
hue=y_train, palette="Set2", s=15, ax=ax
)
ax.tick_params(axis='both', which='major', labelsize=5)
ax.set_title("Before Training", fontsize=6)
ax.legend(loc="upper right", fontsize=4, markerscale=0.5)
st.pyplot(fig, use_container_width=False)
with col2:
fig, ax = plt.subplots(figsize=(3, 2))
plot_decision_regions(X=x_train, y=y_train, clf=model, ax=ax, legend=2)
ax.set_title("Decision Region", fontsize=6)
ax.tick_params(axis='both', which='major', labelsize=5)
ax.legend(loc="upper right", fontsize=4, markerscale=0.5)
st.pyplot(fig, use_container_width=False)
col5, col6 = st.columns(2)
with col5:
fig, ax = plt.subplots(figsize=(3, 2))
ax.plot(range(1, Epochs+1), hist.history['loss'], label='Training Loss')
ax.plot(range(1, Epochs+1), hist.history['val_loss'], label='Validation Loss')
ax.set_title('Model Loss', fontsize=6)
ax.set_xlabel('Epoch', fontsize=6)
ax.set_ylabel('Loss', fontsize=6)
ax.legend(loc="upper right", fontsize=4, markerscale=0.5)
st.pyplot(fig, use_container_width=False)
with col6:
fig, ax = plt.subplots(figsize=(3, 2))
ax.plot(range(1, Epochs+1), hist.history['accuracy'], label='Training Accuracy')
ax.plot(range(1, Epochs+1), hist.history['val_accuracy'], label='Validation Accuracy')
ax.set_title('Model Accuracy', fontsize=6)
ax.set_xlabel('Epoch', fontsize=6)
ax.legend(loc="upper right", fontsize=4, markerscale=0.5)
ax.set_ylabel('Accuracy', fontsize=6)
st.pyplot(fig, use_container_width=False)