
Population Pharmacokinetic−Pharmacodynamic Modeling of Carvedilol to Evaluate the Effect of Cytochrome P450 2D6 Genotype on the Heart Rate Reduction
Metadata
Authors: Sejung Hwang, Soyoung Lee, Jangsoo Yoon, Jae-Yong Chung Journal: Journal of Korean Medical Science Date: 2023 May 8 DOI: 10.3346/jkms.2023.38.e173 PMID: 37272562 PMCID: PMC10244018 URL: https://www.ncbi.nlm.nih.gov/pmc/articles/PMC10244018/ PDF: https://pmc.ncbi.nlm.nih.gov/articles/PMC10244018/pdf/jkms-38-e173.pdf
Abstract
Background: Carvedilol is a beta-adrenergic receptor antagonist primarily metabolized by cytochromes P450 (CYP) 2D6. This study established a carvedilol population pharmacokinetic (PK)–pharmacodynamic (PD) model to describe the effects of CYP2D6 genetic polymorphisms on the inter-individual variability of PK and PD.
Methods: The PK–PD model was developed from a clinical study conducted on 21 healthy subjects divided into three CYP2D6 phenotype groups, with six subjects in the extensive metabolizer (EM, *1/*1, *1/*2), seven in the intermediate metabolizer-1 (IM-1, *1/*10, *2/*10), and eight in the intermediate metabolizer-2 (IM-2, *10/*10) groups. The PK–PD model was sequentially developed, and the isoproterenol-induced heart rate changes were used to establish the PD model. A direct effect response and inhibitory Emax model were used to develop a carvedilol PK–PD model.
Results: The carvedilol PK was well described by a two-compartment model with zero-order absorption, lag time, and first-order elimination. The carvedilol clearance in the CYP2D6*10/*10 group decreased by 32.8% compared with the other groups. The inhibitory concentration of carvedilol estimated from the final PK–PD model was 16.5 ng/mL regardless of the CYP2D6 phenotype.
Conclusion: The PK–PD model revealed that the CYP2D6 genetic polymorphisms were contributed to the inter-individual variability of carvedilol PK, but not PD.
Keywords: Carvedilol, Cytochrome P-450 Enzyme System, Genetic Variation, Pharmacokinetics, Pharmacodynamics
Background
Carvedilol is a beta-adrenergic receptor antagonist primarily metabolized by cytochromes P450 (CYP) 2D6. This study established a carvedilol population pharmacokinetic (PK)–pharmacodynamic (PD) model to describe the effects of CYP2D6CYP2D6 genetic polymorphisms on the inter-individual variability of PK and PD.
Methods
The PK–PD model was developed from a clinical study conducted on 21 healthy subjects divided into three CYP2D6 phenotype groups, with six subjects in the extensive metabolizer (EM, **1/*1**1/*1, **1/*2**1/*2), seven in the intermediate metabolizer-1 (IM-1, **1/*10**1/*10, **2/*10**2/*10), and eight in the intermediate metabolizer-2 (IM-2, **10/*10**10/*10) groups. The PK–PD model was sequentially developed, and the isoproterenol-induced heart rate changes were used to establish the PD model. A direct effect response and inhibitory E_max_max model were used to develop a carvedilol PK–PD model.
Results
The carvedilol PK was well described by a two-compartment model with zero-order absorption, lag time, and first-order elimination. The carvedilol clearance in the CYP2D610/10CYP2D6*10/*10 group decreased by 32.8% compared with the other groups. The inhibitory concentration of carvedilol estimated from the final PK–PD model was 16.5 ng/mL regardless of the CYP2D6 phenotype.
Conclusion
The PK–PD model revealed that the CYP2D6CYP2D6 genetic polymorphisms were contributed to the inter-individual variability of carvedilol PK, but not PD.
**Keywords:**Keywords: Carvedilol, Cytochrome P-450 Enzyme System, Genetic Variation, Pharmacokinetics, Pharmacodynamics
INTRODUCTION
Carvedilol is an α_1_1-, β_1_1-, β_2_2-adrenergic receptor antagonist that reduces heart rate (HR) and blood pressure. It is widely used as a first-line therapy to treat cardiovascular diseases such as hypertension and heart failure.11 Carvedilol is extensively metabolized in the liver by cytochrome P450 (CYP) 2D6 and CYP2C9.22,33 Several active metabolites were identified, including 4′-hydroxyphenyl carvedilol, 5′-hydroxyphenyl carvedilol, and O-desmethyl carvedilol. Among them, only 4′-hydroxyphenyl carvedilol, the main CYP2D6 metabolite, contributes to β-blocking activity with 13 times of carvedilol potency.44 Although 4′-hydroxyphenyl carvedilol concentration is only approximately 10% of carvedilol, the CYP2D6 genotype could impact carvedilol efficacy by affecting the concentration of carvedilol and its metabolites.55,66,77
CYP2D6CYP2D6 is highly polymorphic, with more than 100 known allelic variants, some of which reduce CYP2D6 activity.88 Nine alleles occupy more than 95% of CYP2D6CYP2D6 diplotypes; 11 and 22 are normal function alleles; 33, 44, 55, and 66 are nonfunctional alleles; and 1010, 1717, and 4141 are decreased function alleles.99,1010 Owing to the highly polymorphic characteristics of CYP2D6, the dosage of many drugs, including antidepressants, should be adjusted based on genotype alleles.88 However, according to current clinical guidelines, carvedilol dosage does not need to be adjusted based on the CYP2D6 genotype,88 although the CYP2D6CYP2D6 allele distribution differs among various races and ethnicities.99,1010,1111 In Koreans, the allele frequency of decreased function for 1010 and 4141 is 42.7–47.3% and 1.1–2.2%, while in Caucasians, it is 0.9–2.8% and 3.1–11.7%, respectively.99,1010,1111 However, the effects of various alleles on CYP2D6 activity and the efficacy of carvedilol are insufficiently described. Therefore, a previous study investigated the effects of CYP2D6CYP2D6 genetic polymorphisms on the pharmacokinetics (PK) and pharmacodynamics (PD) of carvedilol in a Korean population.1212 Based on the data from that study, we developed a PK−PD model for carvedilol in Koreans.
PK−PD modeling can explain the causative relationship between drug exposure and response to better understand the observed drug effect and a tool to quantify the variability in drug exposure and response.1313 There are several PK−PD models for β-blockers, especially carvedilol, using clinical data.1414 One PK−PD model demonstrated the relationship between (S)-carvedilol and HR reduction in exercise-induced tachycardia.1515 Another study investigated the relationship between carvedilol concentration and blood pressure.1616 However, there is no reported PK−PD model using an elaborate PD marker and investigating the effect of CYP2D6CYP2D6 polymorphism on the inter-individual variability of carvedilol PK. Therefore, we developed a PK−PD model to investigate the effect of CYP2D6CYP2D6 polymorphism on carvedilol PK and PD and to explore the inhibitory concentration of carvedilol effect in healthy Koreans.
METHODS
Data
Data from an open-label, one-sequence, multiple-dosing study involving healthy subjects (n = 21) were used in this population PK−PD analysis. Three functional phenotypic groups for CYP2D6CYP2D6 genetic variants, extensive metabolizer (EM, 11/11, 11/22), intermediate metabolizer-1 (IM-1, 11/1010, 22/1010), and intermediate metabolizer-2 (IM-2, 1010/1010), were included in the analysis. Blood samples were obtained before and after a 12.5-mg single dose of carvedilol and after multiple doses of once-daily 25-mg carvedilol at 0, 0.25, 0.5, 1, 2, 3, 4, 6, 8, 12, and 24 hours to evaluate the PK characteristics. An isoproterenol sensitivity test (IST) was performed at the baseline and after single and multiple carvedilol administrations to evaluate carvedilol PD. The isoproterenol dosing scheme was 0.25, 0.5, 1, and 2 μg at baseline and 5, 10, 20, and 40 μg after single and multiple doses of carvedilol. Isoproterenol was injected until the HR was > 140 bpm or showed an increase of 30 bpm compared with the pre-dose rate.
PK−PD model development
First, we developed and finalized a PK model, including the covariate effects involving CYP2D6CYP2D6 genetic variants. Second, we developed a PD model using a baseline isoproterenol model and post hoc Bayesian PK parameter estimates for each individual. Finally, we re-evaluated the covariate effects for a PK−PD model and developed and finalized a sequential PK−PD model.1717,1818
The PK structural models were explored, including one- and two-compartment models with first- and zero-order and combined absorption models with and without lag time. The interindividual variability (IIV) of PK parameters was described as an exponential model, assuming a normal distribution with a mean of zero and a variance of ω^2^2.
| Pi = PTV × eηi | (1) |
|---|---|
| In equation (1), P_i_i is the parameter estimate of the i^th^th individual subject, P_TV_TV is the parameter estimate of the typical population, and η_i_i is the interindividual random effects. A proportional error model was used for residual variability. |
| Cij = Cpred,ij × (1 + εij) | (2) |
|---|---|
| In equation (2), C_ij_ij is the j^th^th observed concentration in the i^th^th individual subject, C_pred,ij_pred,ij is the predicted concentration, and ε_ij_ij is the proportional residual random error. All potential covariates, including age, height, weight, and CYP2D6 phenotypes, were evaluated to determine whether they significantly affected the IIV of PK parameters. |
The baseline isoproterenol model was explored using a sigmoid E_max_max model or simple E_max_max model involving isoproterenol dose and HR for the base structure model.
| E = E0 + Emax × DγED50γ + Dγ | (3) |
|---|---|
| In equation (3), E is the effect of isoproterenol at the isoproterenol dose (D), E_0_0 is the HR baseline, E_max_max is the maximal effect of isoproterenol for HR induction, ED_50_50 is the isoproterenol dose to achieve the half-maximal effect of isoproterenol, and γ is the Hill exponent. A direct effect response model was developed for isoproterenol because its HR induction was rapid with no delayed response.1313,1919 |
We developed the PD model for carvedilol by modifying the E_max_max model for competitive antagonism with isoproterenol.1818,2020
| E = E0 + Emax × DγED50(1 + CIC50)γ + Dγ | (4) |
|---|---|
| In equation (4), E is the effect of the combination of isoproterenol and carvedilol, E_0_0 is the baseline for HR, E_max_max is the maximal effect of isoproterenol for HR reduction, IC_50_50 is the inhibitory concentration of carvedilol to achieve the half-maximal effect, and C is the carvedilol concentration. |
The exponential model was used for the IIV of the final PD parameters, and an additional error model was used for the residual variability, as follows:
| Eij = Epred,ij + εij | (5) |
|---|---|
| where E_ij_ij is the j^th^th observed effect in the i^th^th individual subject, E_pred,ij_pred,ij is the predicted concentration, and ε_ij_ij is the additional residual random error. |
After developing the PK−PD model, the effects of the covariates on the final PK−PD model were screened for age, height, weight, and CYP2D6 phenotype. The continuous covariates such as age were incorporated into the model with the power model in which the covariate was normalized by the median value, as follows:
| Pi = PTV × CoviCovmedεi | (6) |
|---|---|
| where Cov_i_i is the i^th^th individual value of a particular covariate and Cov_med_med is the median value of a particular covariate. |
The categorical covariate (CYP2D6 phenotype) was incorporated into the model using the following equation:
| Pi = PTV × (1 − Pdiff) × eηi | (7) |
|---|---|
| where P_diff_diff is the fixed effect parameter to estimate the difference of the parameters between the CYP2D6 phenotypes. |
Covariate analyses using the forward-addition and backward-elimination methods were conducted after screening. The likelihood ratio test was used to evaluate the effect of the covariates on the model parameters.
Model evaluation
The model was evaluated using goodness-of-fit (GOF) plots and visual prediction checks (VPCs). The bootstrap method was used to create 1,000 datasets by random resampling of the original data to evaluate the robustness of the final PK and PK−PD models. The median parameters and 95% confidence intervals (CIs) were compared with the parameter estimates of the final PK and PK−PD models. Shrinkage was assessed whether the parameter was appropriately estimated, not overfitted.
Software implementation and model selection
Nonlinear mixed-effects modeling (NONMEM) software, version 7.4.4 (ICON, Ellicott City, MD, USA), was used to develop the PK and PK−PD models. Population PK−PD analysis was conducted using the first-order conditional estimation method with the interaction (FOCE-I) method. The objective function value (OFV) was used for model selection and evaluation. The change in OFV between the two nested models was assumed to follow a χ^2^2 distribution. A decrease of 3.84 OFV (PP < 0.05) was considered a statistically significant improvement. Following covariate analysis, the covariate was selected if there was a significant decrease in the OFV (≥ 3.84, PP < 0.05), and the significant covariates were added to the model. Subsequently, each covariate was removed from the model, and the covariate was considered significant if the OFV increased by ≥ 3.84 (PP < 0.05).
Ethics statement
This clinical trial was conducted in accordance with the Declaration of Helsinki and Korean Good Clinical Practice and approved by the Institutional Review Board of Seoul National University Bundang Hospital, Seongnam, South Korea (IRB No. B-1408/263-008). Details of the study design are available in a previous report (NCT02286934NCT02286934).1212 Informed consent was submitted by all subjects when they were enrolled in the clinical trial.
RESULTS
Study population
A total of 450 plasma observations and 1003 HR observations from 21 subjects were used to develop PK and PD models. The demographic characteristics of the dataset are presented in Table 1Table 1. Among the 21 subjects, six were in the CYP2D6CYP2D6 EM group, seven in the IM-1 group, and eight in the IM-2 group (Table 1Table 1). There were no significant differences in demographics between the CYP2D6 phenotypes (Table 1Table 1).
Table 1. Demographic characteristics of the subjects.
| Characteristics | Total | EM (CYP2D6*1/*1, *1/*2) | IM-1 (CYP2D6*1/*10, *2/*10) | IM-2 (CYP2D6*10/*10) |
|---|---|---|---|---|
| No. of subjects | 21 | 6 | 7 | 8 |
| Age, yr | 27.3 ± 4.7 | 28.5 ± 3.5 | 29.6 ± 6.1 | 24.4 ± 2.7 |
| Sex | ||||
| Male | 21 (100) | 6 (100) | 7 (100) | |
| Height, cm | 174.2 ± 6.6 | 175.5 ± 4.2 | 174.9 ± 9.9 | 172.6 ± 4.9 |
| Weight, kg | 70.4 ± 9.6 | 79.3 ± 3.9 | 69.5 ± 10.3 | 64.5 ± 7.4 |
| BMI, kg/m2 | 23.1 ± 2.4 | 25.8 ± 1.1 | 22.7 ± 2.3 | 21.6 ± 1.4 |
PK modeling
The PK of carvedilol in healthy subjects was well described using a two-compartment model, zero-order absorption with lag time, and first-order elimination (Fig. 1Fig. 1). As absorption models including first order absorption, first order absorption with lag time and dual absorption models did not well describe the PK data of carvedilol, zero-order absorption with lag time model was selected. The addition of IIV on clearance (CL/F), V_c_c/F, and T_lag_lag improved the PK model estimation (ΔOFV = −429.93). Covariate analysis results revealed that the CYP2D6 phenotype was significantly associated with CL/F, and the inter-individual variability decreased from 26.8% to 14.6% (ΔOFV = −27.50), but age, height, and weight were not significant. Table 2Table 2 summarizes the parameter estimates and relative standard errors (RSEs) of the PK parameters and coefficients of variation. Carvedilol CL/F decreased by 32.8% in IM-2 group subjects compared with the other subjects.
Fig. 1.
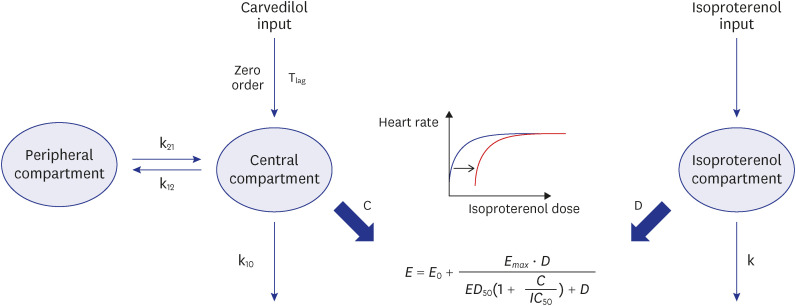
Final PK−PD model structure of carvedilol. The PD model was developed based on HR changes detected from isoproterenol sensitivity tests linked to the PD model. The final PK−PD model describes carvedilol PK and HR response to carvedilol. C = carvedilol concentration, D = isoproterenol dosage, ED50 = half-maximal effective isoproterenol dosage, Emax = maximal effect of isoproterenol, HR = heart rate, IC50 = half-maximal inhibitory carvedilol concentration, k = elimination rate constant of isoproterenol, k10 = elimination rate constant of carvedilol from the central compartment, k12 = rate transfer constant from the central compartment to the peripheral compartment, k21 = rate transfer constant from the peripheral compartment to the central compartment, PD = pharmacodynamic, PK = pharmacokinetic, Tlag = lag time for zero-order absorption.
Table 2. Parameter estimation of the final PK model and bootstrap results for carvedilol.
| Parameters | Final model | Bootstrap (n = 1,000) |
|---|---|---|
| Estimate (RSE, %) | Median (95% CI) | |
| Population parameters | ||
| D1 (h) | 0.383 (70) | |
| Tlag (h) | 0.215 (0.6) | |
| CL/F (L/h) | 153 (0.7) | |
| IM-2 effect on CL/Fa | ||
| Vc/F (L) | 440 (35) | |
| Vp/F (L) | 754 (2.3) | |
| Q/F (L/h) | 41.3 (5.1) | |
| Interindividual variability (coefficient of variation, CV%) [η shrinkage] | ||
| ωTlag | 56.8 (12.9) [7%] | |
| ωCL/F (%) | 14.6 (9.8) [11%] | |
| ωVc (%) | 26.1 (9.2) [31%] | |
| Residual error | ||
| Proportional error | 0.379 (2.2) | |
| The GOF plots indicated that the model structure well described the PK and did not indicate a bias for PK prediction (Fig. 2AFig. 2A). The results of the visual predictive checks showed good predictive performance of the PK model after a single 12.5-mg dose and multiple 25-mg doses of carvedilol (Fig. 2B and CFig. 2B and C). The bootstrap estimates and 95% CIs were consistent with the parameter estimates of the final model (Table 2Table 2). According to the eta shrinkage, the PK model appropriately estimated the PK parameters (Table 2Table 2). |
Fig. 2.
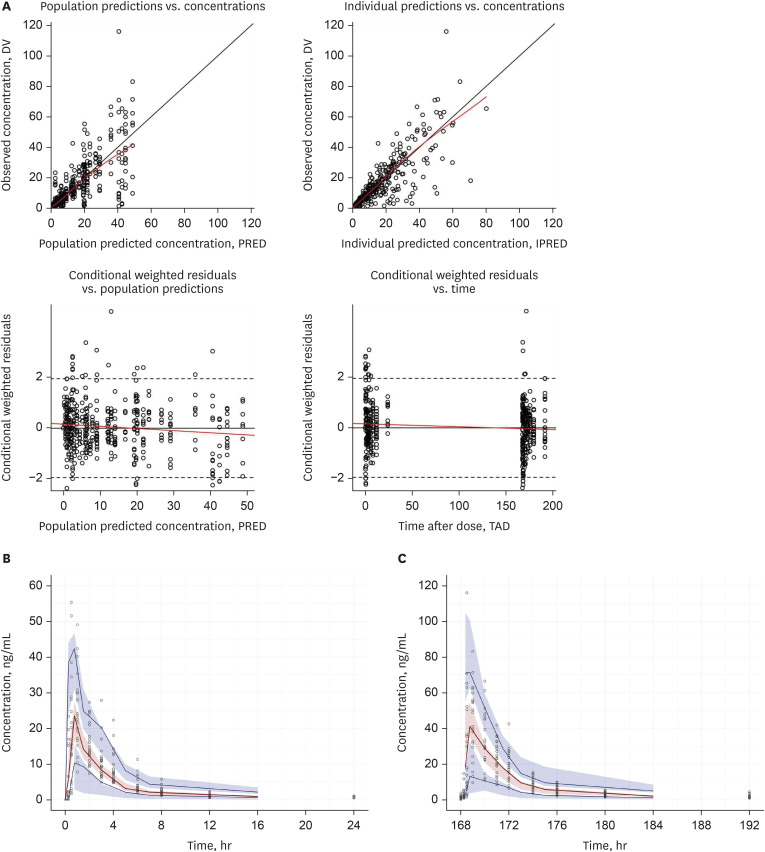
Goodness-of-fit plots of carvedilol and visual predictive checks for the final PK model of carvedilol. (A) Goodness-of-fit plots of the final PK model. Open circles indicate observations; solid black lines are identity lines; red lines represent locally weighted scatterplot smoothing. Visual predictive checks of the final PK model (B) after a single 12.5-mg dose of carvedilol and (C) after multiple 25-mg doses of carvedilol. Open circles represent carvedilol plasma concentrations; solid lines represent the 5th (blue), median (red), and 95th (blue) concentration percentiles; blue and red areas indicate the 90% confidence interval of the simulated concentrations of each percentile. PK = pharmacokinetic.
PK−PD modeling
A simple E_max_max model was selected with γ fixed as 1 for the baseline isoproterenol model evaluated by GOF and appropriate parameter estimates. There were no significant covariates including CYP2D6 phenotype affecting parameters in the baseline isoproterenol model. Individual PK parameters considering the CYP2D6 phenotype from the PK model were incorporated into the PK−PD model. The PK−PD model was developed to explain HR reduction by carvedilol using the modified E_max_max receptor model for competitive antagonism with isoproterenol (Fig. 1Fig. 1). The addition of IIV to E_0_0 and E_max_max improved the estimation of the final PD model (ΔOFV = −541.97) (Table 3Table 3). The population parameter estimates (residual standard error) of the baseline HR (E_0_0), isoproterenol potency (ED_50_50), maximal isoproterenol effect (E_max_max) on HR reduction from the final model were 60.4 bpm (3.1%), 0.69 μg (30.9%), and 30.7 bpm (21.9%), respectively (Table 3Table 3). None of the covariates, including the CYP2D6 phenotype, had significant effects on the PD parameters, and the IC_50_50 estimated from the final model was 16.5 ng/mL regardless of the CYP2D6 phenotype.
Table 3. Parameter estimation of the final PD model and bootstrap results for carvedilol.
| Parameters | Final model | Bootstrap (n = 1,000) |
|---|---|---|
| Estimate (RSE, %) | Median (95% CI) | |
| Population parameters | ||
| E0 (bpm) | 60.4 (3.1) | |
| ED50 (μg) | 0.685 (30.9) | |
| Emax (bpm) | 30.7 (21.9) | |
| IC50 (ng/mL) | 16.5 (34.4) | |
| Interindividual variability (coefficient of variation, CV%) [η shrinkage] | ||
| ωE0 (%) | 13.5 (12.7) [0%] | |
| ωEmax (%) | 65.4 (27) [8%] | |
| Residual error | ||
| Additive error | 64.2 (5.9) | |
| The GOF plots indicated that the model structure well described the PD and did not indicate a bias for PD prediction (Fig. 3AFig. 3A). VPCs indicated a good predictive performance of the final model (Fig. 3B, C, and DFig. 3B, C, and D). The peak of HR in VPCs were induced by the injection of isoproterenol for the IST resulting the increase of HR. The bootstrap estimates and 95% CIs were consistent with the parameter estimates of the final PD model (Table 3Table 3). The final PK−PD model precisely estimated the individual parameters based on the low value of eta shrinkage (Table 3Table 3). |
Fig. 3.
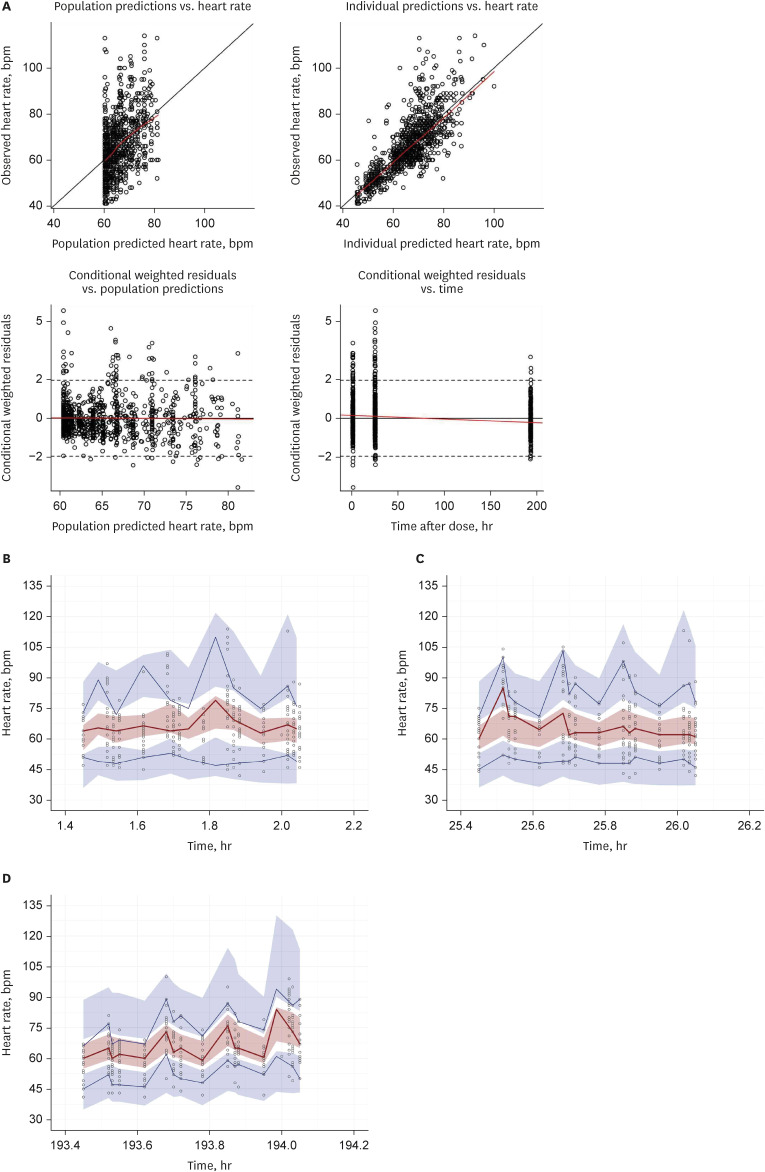
Goodness-of-fit plots of heart rate and visual predictive checks for the final PK−PD model. (A) Goodness-of-fit plots of the final PK−PD model. Open circles indicate observations; solid black lines are identity lines; red lines represent locally weighted scatterplot smoothing. Visual predictive checks for HR after IST (B) in baseline, (C) after a single 12.5-mg dose of carvedilol and (D) after multiple 25-mg doses of carvedilol. Open circles represent carvedilol plasma concentrations; solid lines represent the 5th (blue), median (red), and 95th (blue) concentration percentiles; blue and red areas indicate the 90% confidence interval of the simulated concentrations of each percentile. PK = pharmacokinetic, PD = pharmacodynamic, IST = isoproterenol sensitivity test.
DISCUSSION
To the best of our knowledge, the PK−PD model developed in this study is the first to describe the relationship between carvedilol exposure and HR response combined with isoproterenol and quantify the CYP2D6CYP2D6 polymorphism effect on carvedilol PK variability in healthy subjects. The large value of RSE of PK parameter associated with the absorption, duration of zero-order absorption (D1), from the final PK model suggested the parameter uncertainty. However, it was evaluated that the final PK model well described the carvedilol PK considering the results of bootstrap. In this study, the model well described the effect of CYP2D6CYP2D6 polymorphism on carvedilol PK and PD, and revealed that CYP2D6CYP2D6 polymorphism was contributed to the inter-individual variability of carvedilol PK.
A previous PK−PD analysis of carvedilol showed that the CYP genotype influenced the PK characteristics, but not the PD response of carvedilol.1212 This population PK−PD analysis also showed that CYP2D610/10CYP2D6*10/10 subjects had a 32.7% lower carvedilol CL/F than CYP2D61/1CYP2D61/*1 and **1/*2**1/*2 subjects. Consistent with previous clinical studies,2121,2222 this study showed that CYP2D6CYP2D6 genetic polymorphism did not have a significant impact on the negative chronotropic effect of carvedilol. The metabolic ratios of carvedilol metabolites (4′-hydroxyphenyl carvedilol, 5′-hydroxyphenyl carvedilol, and O-desmethyl carvedilol) for most of subjects were below 0.1. Therefore, the PK−PD model was only constructed for carvedilol like other PK models.1616,2323
So far, various carvedilol PK models including this study have been reported. In previous other studies, carvedilol PKs have been described by one- or two-compartment models with first-order absorption in congestive heart failure patients and healthy subjects, respectively.1616,2222,2323 The differences in CYP frequencies and PK sampling points may have resulted in PK structural model variations between the studies. In this study, CYP2D6 phenotype frequencies were equal in the CYP2D6CYP2D6 EM (**1/*1**1/*1 and **1/*2**1/*2), IM-1 (**1/*10**1/*10 and **2/*10**2/*10), and IM-2 (**10/*10**10/*10) groups, whereas in other studies, the frequencies between the phenotypes were unknown or inconsistent.1616,2323,2424 Furthermore, the PK sampling points in this study were abundant in the absorption phase, which may have contributed to a more appropriate absorption model. Considering these differences, a two-compartment model with zero-order absorption and lag time that we developed well explained the carvedilol PK.
The final PK−PD model in this study showed that only CYP2D6CYP2D6 polymorphism influenced carvedilol CL/F. In this study, the data were obtained from healthy subjects, not patients, and the demographic characteristics, including body weight, concomitant therapy, and smoking, were similar among the subjects. However, other studies suggested that total body weight, α1-acid glycoprotein, concomitant digoxin therapy, and tobacco use also affected carvedilol PK variability.2323,2424 These differences might have resulted from the data sources used to develop the model between patients with congestive heart failure and healthy subjects. Nevertheless, the similarity of demographic characteristics in this study would be rather appropriate to investigate the effect on PD while excluding other confounding factors.
The final model sensitively detected the β-adrenergic receptor inhibition of carvedilol, using isoproterenol as an elaborate and accurate indirect marker. As isoproterenol-induced tachycardia is a reliable method for investigating the efficacy of β-blockers, we established a simple E_max_max model and directly linked it to the effect on HR because of the direct and rapid effect of isoproterenol.2525,2626 The E_max_max model was then modified for carvedilol, a competitive antagonist of isoproterenol.1818,2020 The baseline HR from the final PK−PD model in this study was estimated at 60 bpm. The maximum effect estimated in this study was estimated as 30.7 bpm which means that the maximum increase for HR was 30.7 bpm from the baseline. Tenero et al.1515 also used the E_max_max model to describe the PD of carvedilol, in which the baseline exercise-induced HR and maximal decreasing effect of carvedilol were estimated at 146 and 19.2 bpm, respectively. The differences between the results were primarily because of the methods used to induce tachycardia. Tenero et al.1515 used exercise to induce the tachycardia for measuring the clinical effect of β-antagonist, thereby showing a higher baseline HR.
The PK−PD relationship in this study was described by the simple E_max_max model, which was identified with similar profiles in the previous study, regardless of 12.5- or 25-mg dose.2121 Carvedilol PK showed dose-proportionality in the dose range of 6.25–50 mg.33 According to the results, the higher dose of carvedilol seems to show higher probability to achieve the maximal effect for HR reduction.
This PK−PD modeling was the first investigation to estimate the IC_50_50 of carvedilol inhibition on isoproterenol induced tachycardia in human as 16.5 ng/mL. Carvedilol is a racemic mixture with a systemic exposure R/S ratio of approximately 2 and S(-)-carvedilol has β-blocking activity like HR reduction.66 Carvedilol has a flat concentration−effect relationship at S(-)-carvedilol concentrations > 20 nmol/L, and Tenero et al.66 estimated the concentration of half maximal effect for S(-)-carvedilol as 7.7 ng/mL.2121 Therefore, the IC_50_50 calculated to achieve the half-maximal effect for HR reduction which was the β-blocking activity in this study seems rational.
The study results showed that low-function CYP2D6CYP2D6 variants (**10/*10**10/*10) significantly decreased carvedilol CL/F by approximately 32.7% and demonstrated that CYP2D6CYP2D6 polymorphism can explain the inter-individual variability of carvedilol CL/F. However, consistent with previous studies, CYP2D6 phenotypes had a negligible effect on carvedilol PD.1212,2121 Additionally, among the racemic forms, only S(-)-carvedilol shows β-blocking activity and a higher affinity for various CYP enzymes, including CYP2D6, CYP1A2CYP2D6, CYP1A2, 2E12E1, and *3A4.*3A4.22,55 Considering the multiple metabolic pathways of carvedilol, it is plausible that CYP2D6CYP2D6 variations did not affect its HR reduction activity.
In conclusion, this study was the first study to identify the effects of CYP2D6CYP2D6 polymorphism on PK−PD and quantify its variability in healthy subjects using the population PK−PD modeling approach. The decreased function CYP2D6CYP2D6 allele may have moderately affected carvedilol CL/F; however, it did not influence its negative chronotropic effect. Therefore, dosage adjustment of carvedilol based on the CYP2D6CYP2D6 genotype is not recommended in routine clinical settings.
ACKNOWLEDGMENTS
The clinical study was conducted at the Clinical Trials Center, Seoul National University Bundang Hospital.
Footnotes
References
Ruffolo RR, Jr, Gellai M, Hieble JP, Willette RN, Nichols AJ. The pharmacology of carvedilol. Eur J Clin Pharmacol. 1990;38(Suppl 2):S82–S88. doi: 10.1007/BF01409471. DOI | PubMed | Google Scholar
Oldham HG, Clarke SE. In vitro identification of the human cytochrome P450 enzymes involved in the metabolism of R(+)- and S(-)-carvedilol. Drug Metab Dispos. 1997;25(8):970–977. PubMed | Google Scholar
U.S. Food and Drug Administration. Coreg (carvedilol) [package insert] [Updated 2017]. [Accessed May 7, 2021]. https://www.accessdata.fda.gov/drugsatfda_docs/label/2017/020297s038lbl.pdf . https://www.accessdata.fda.gov/drugsatfda_docs/label/2017/020297s038lbl.pdf
Stafylas PC, Sarafidis PA. Carvedilol in hypertension treatment. Vasc Health Risk Manag. 2008;4(1):23–30. doi: 10.2147/vhrm.2008.04.01.23. DOI | PMC free article | PubMed | Google Scholar
Morgan T. Clinical pharmacokinetics and pharmacodynamics of carvedilol. Clin Pharmacokinet. 1994;26(5):335–346. doi: 10.2165/00003088-199426050-00002. DOI | PubMed | Google Scholar
Tenero D, Boike S, Boyle D, Ilson B, Fesniak HF, Brozena S, et al. Steady-state pharmacokinetics of carvedilol and its enantiomers in patients with congestive heart failure. J Clin Pharmacol. 2000;40(8):844–853. doi: 10.1177/00912700022009576. DOI | PubMed | Google Scholar
Gehr TW, Tenero DM, Boyle DA, Qian Y, Sica DA, Shusterman NH. The pharmacokinetics of carvedilol and its metabolites after single and multiple dose oral administration in patients with hypertension and renal insufficiency. Eur J Clin Pharmacol. 1999;55(4):269–277. doi: 10.1007/s002280050628. DOI | PubMed | Google Scholar
Taylor C, Crosby I, Yip V, Maguire P, Pirmohamed M, Turner RM. A review of the important role of CYP2D6 in pharmacogenomics. Genes (Basel) 2020;11(11):1295. doi: 10.3390/genes11111295. DOI | PMC free article | PubMed | Google Scholar
Byeon JY, Kim YH, Lee CM, Kim SH, Chae WK, Jung EH, et al. CYP2D6 allele frequencies in Korean population, comparison with East Asian, Caucasian and African populations, and the comparison of metabolic activity of CYP2D6 genotypes. Arch Pharm Res. 2018;41(9):921–930. doi: 10.1007/s12272-018-1075-6. DOI | PubMed | Google Scholar
Lee SY, Sohn KM, Ryu JY, Yoon YR, Shin JG, Kim JW. Sequence-based CYP2D6 genotyping in the Korean population. Ther Drug Monit. 2006;28(3):382–387. doi: 10.1097/01.ftd.0000211823.80854.db. DOI | PubMed | Google Scholar
Neafsey P, Ginsberg G, Hattis D, Sonawane B. Genetic polymorphism in cytochrome P450 2D6 (CYP2D6): population distribution of CYP2D6 activity. J Toxicol Environ Health B Crit Rev. 2009;12(5-6):334–361. doi: 10.1080/10937400903158342. DOI | PubMed | Google Scholar
Jung E, Ryu S, Park Z, Lee JG, Yi JY, Seo DW, et al. Influence of CYP2D6 polymorphism on the pharmacokinetic/pharmacodynamic characteristics of carvedilol in healthy Korean volunteers. J Korean Med Sci. 2018;33(27):e182. doi: 10.3346/jkms.2018.33.e182. DOI | PMC free article | PubMed | Google Scholar
Derendorf H, Lesko LJ, Chaikin P, Colburn WA, Lee P, Miller R, et al. Pharmacokinetic/pharmacodynamic modeling in drug research and development. J Clin Pharmacol. 2000;40(12 Pt 2):1399–1418. PubMed | Google Scholar
Höcht C, Bertera FM, Mauro JS, Parola L, Taira CA. PK/PD modeling of β-Blockers in cardiovascular disease: an update. Int J Pharmacokinet. 2016;1(1):55–68. Google Scholar
Tenero DM, Henderson LS, Campanile AM, Baidoo CA, Boyle D. Development of a pharmacokinetic/pharmacodynamic model for carvedilol to predict beta1-blockade in patients with congestive heart failure. Am J Cardiol. 2006;98(7A):27L–31L. doi: 10.1016/j.amjcard.2006.07.016. DOI | PubMed | Google Scholar
Baek IH, Yun MH, Yun HY, Kwon KI. Pharmacokinetic/pharmacodynamic modeling of the cardiovascular effects of beta blockers in humans. Arch Pharm Res. 2008;31(6):814–821. doi: 10.1007/s12272-001-1231-4. DOI | PubMed | Google Scholar
Zhang L, Beal SL, Sheiner LB. Simultaneous vs. sequential analysis for population PK/PD data I: best-case performance. J Pharmacokinet Pharmacodyn. 2003;30(6):387–404. doi: 10.1023/b:jopa.0000012998.04442.1f. DOI | PubMed | Google Scholar
Upton RN, Mould DR. Basic concepts in population modeling, simulation, and model-based drug development: part 3-introduction to pharmacodynamic modeling methods. CPT Pharmacometrics Syst Pharmacol. 2014;3(1):e88. doi: 10.1038/psp.2013.71. DOI | PMC free article | PubMed | Google Scholar
Arnold JM, McDevitt DG. Heart rate and blood pressure responses to intravenous boluses of isoprenaline in the presence of propranolol, practolol and atropine. Br J Clin Pharmacol. 1983;16(2):175–184. doi: 10.1111/j.1365-2125.1983.tb04982.x. DOI | PMC free article | PubMed | Google Scholar
Gabrielsson J, Weiner D. Pharmacokinetic and Pharmacokinetic Data Analysis: Concepts and Applications. 3rd ed. Stockholm, Sweden: Swedish Pharmaceutical Press; 2000. Google Scholar
Sehrt D, Meineke I, Tzvetkov M, Gültepe S, Brockmöller J. Carvedilol pharmacokinetics and pharmacodynamics in relation to CYP2D6 and ADRB pharmacogenetics. Pharmacogenomics. 2011;12(6):783–795. doi: 10.2217/pgs.11.20. DOI | PubMed | Google Scholar
Shihmanter R, Nulman I, Goland S, Caspi A, Bar-Haim A, Harary I, et al. Variation in the CYP2D6 genotype is not associated with carvedilol dose changes in patients with heart failure. J Clin Pharm Ther. 2014;39(4):432–438. doi: 10.1111/jcpt.12154. DOI | PubMed | Google Scholar
Nikolic VN, Jankovic SM, Velickovic-Radovanović R, Apostolović S, Stanojevic D, Zivanovic S, et al. Population pharmacokinetics of carvedilol in patients with congestive heart failure. J Pharm Sci. 2013;102(8):2851–2858. doi: 10.1002/jps.23626. DOI | PubMed | Google Scholar
Saito M, Kawana J, Ohno T, Hanada K, Kaneko M, Mihara K, et al. Population pharmacokinetics of R- and S-carvedilol in Japanese patients with chronic heart failure. Biol Pharm Bull. 2010;33(8):1378–1384. doi: 10.1248/bpb.33.1378. DOI | PubMed | Google Scholar
van Steeg TJ, Freijer J, Danhof M, de Lange EC. Pharmacokinetic-pharmacodynamic modelling of S(-)-atenolol in rats: reduction of isoprenaline-induced tachycardia as a continuous pharmacodynamic endpoint. Br J Pharmacol. 2007;151(3):356–366. doi: 10.1038/sj.bjp.0707234. DOI | PMC free article | PubMed | Google Scholar
Cleaveland CR, Rangno RE, Shand DG. A standardized isoproterenol sensitivity test. The effects of sinus arrhythmia, atropine, and propranolol. Arch Intern Med. 1972;130(1):47–52. doi: 10.1001/archinte.130.1.47. DOI | PubMed | Google Scholar